Thread
Look at this diagram for sticky wages by MRU (Cowen and Tabarrok). It clearly shows a mismatch between Qs and Qd in a labor market.
Pay close attention to the causes of sticky wages as explained by Tabarrok: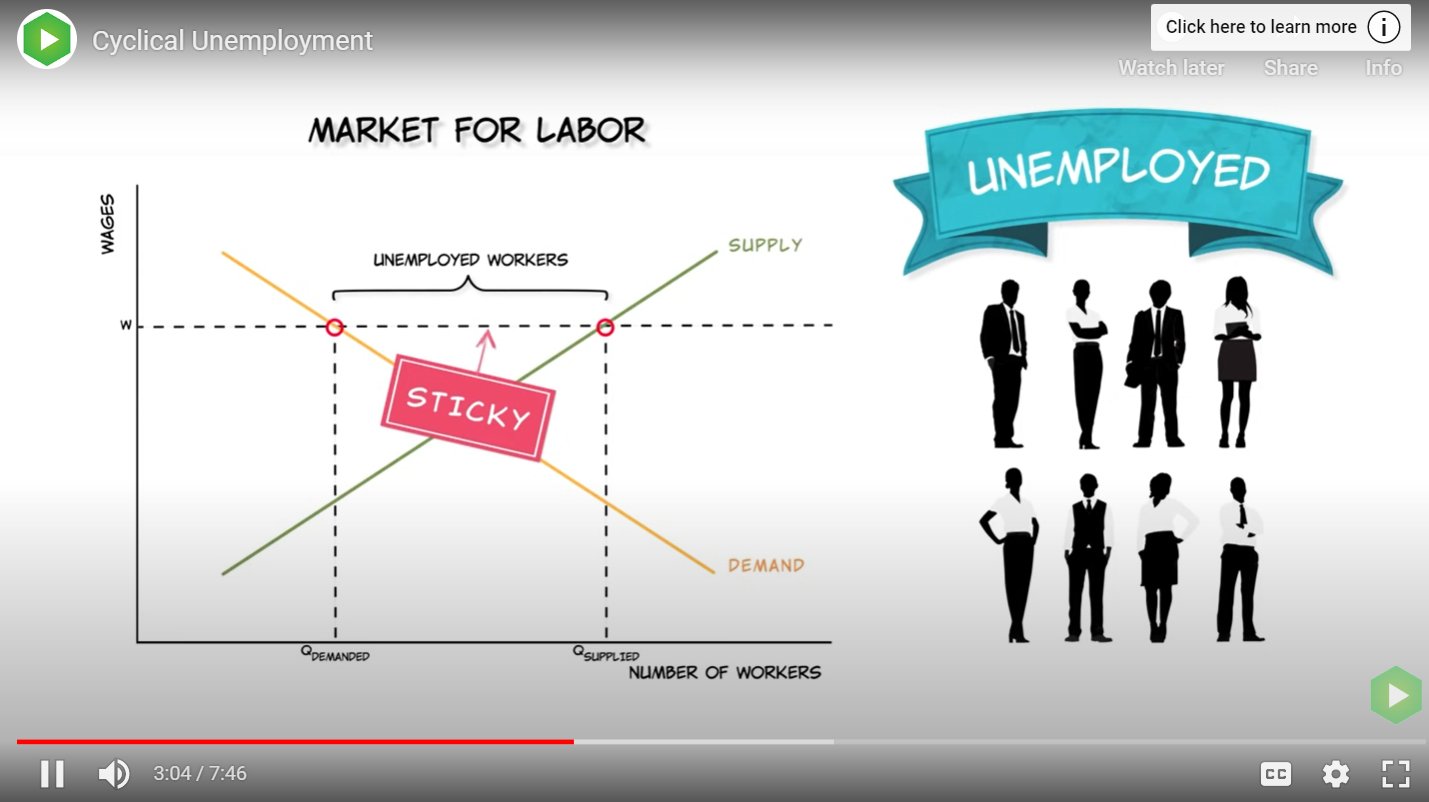
Pay close attention to the causes of sticky wages as explained by Tabarrok:

"human beings get very upset when their wages fall"
"because of the fear of reducing morale, employers are very reluctant to reduce nominal wages"
"unemployed workers may also take time to learn or to accept that their wages have fallen"
"because of the fear of reducing morale, employers are very reluctant to reduce nominal wages"
"unemployed workers may also take time to learn or to accept that their wages have fallen"
More: "workers may also be afraid to accept a low quality job for fear of being branded a low quality worker"
He also lists unions creating "contractual limits on how low wages can go." Also, minimum wages create legal limits.
He also lists unions creating "contractual limits on how low wages can go." Also, minimum wages create legal limits.
Now, I have no disagreement that a binding minimum wage causes a labor market to look like the one in the first tweet. But all of the other stated reasons for sticky wages are things that are *already factored into the labor supply and demand schedules*.
Consider one worker's labor supply curve. Suppose he one who "gets very upset when his wages fall". How would we show this in a standard supply and demand graph? Would we put in the equivalent of a price floor at this guy's "very upset" threshold?
No! We would say he has a flat section of his supply curve at that potential wage.
So, when the demand for his labor decreases, and we see the wage doesn't fall to a point that we might expect if he had a gentle-sloping supply curve, and instead he reduces his hours...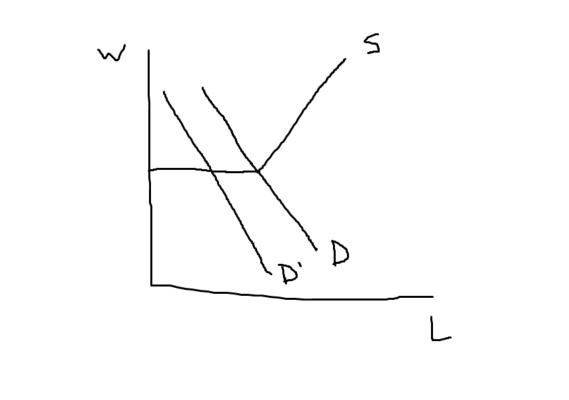
So, when the demand for his labor decreases, and we see the wage doesn't fall to a point that we might expect if he had a gentle-sloping supply curve, and instead he reduces his hours...

... we shouldn't say that there's something wrong with labor markets or that they aren't clearing, but that the market is clearing and maybe our preconceptions of what his labor supply curve looks like were wrong.
Same for the employers who "are very reluctant to reduce nominal wages" out of "fear of reducing morale."
It's just a flat section of a demand curve!
It's just a flat section of a demand curve!
Mentions
See All
Per Bylund @PerBylund
·
Feb 21, 2023
Good thread by a good economist: